ListManager offers extensive reporting on your mailings and membership. There are eight categories of pre-built reports: Mailings, Members, Server Performance, Web site, Purchases, Interest and Surveys. If ListManager doesn't have the built-in chart you're looking for, create your own in Custom Charts. In addition, a sales-cycle map and a general map of all charts allow you to access all the reports in one view, to find the one you need more quickly.
The EmailAdvisor reports are also available here if you subscribe to the EmailAdvisor service.
The charts available to you depend on your license level. Purchases and Interest charts are available to Enterprise license levels only. Contact your account representative at sales@lyris.com if you'd like to upgrade to ListManager Pro or Enterprise.
Note that the charts will only display 19 data points, but the chart table will have all the data points for that report. All the data for the selected report may be downloaded as a csv file by clicking on the disk icon in the upper right hand corner of the table.
The Lyris logo may be removed or your own logo inserted if you have the Rebrandable version of ListManager.
Depending on the kind of report you select, the following selections may be available to you:
![]()
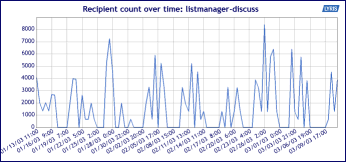
Line Chart
When you click on the Line Chart Icon, this is how you will see your data displayed:
![]()
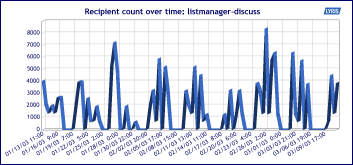
3D Line Chart
When you click on the 3D Line Chart Icon, this is how you will see your data displayed:
![]()
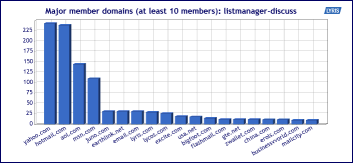
Bar Chart
When you click on the Bar Chart Icon, this is how you will see your data displayed:
![]()
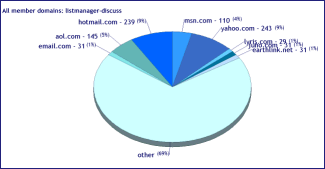
Pie Chart
When you click on the Pie Chart Icon, this is how you will see your data displayed:
![]()
Table
When you click on the Table Icon, this is how you will see your data displayed:
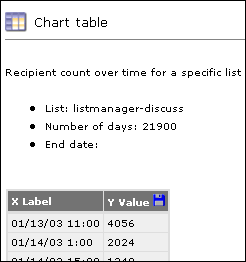
Note that the charts will only display 19 data points, but the chart table will have all the data points for that report. All the data for the selected report may be downloaded as a csv file by clicking on the disk icon in the upper right hand corner of the table.
![]()
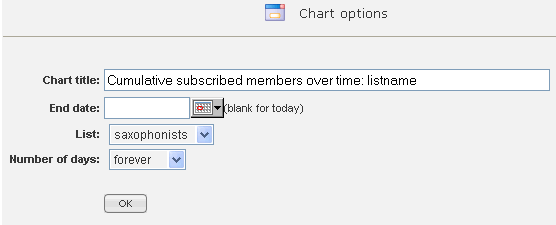
Click on the Change Chart Properties to change the parameters of your chart - the dates charted, for example.
![]()
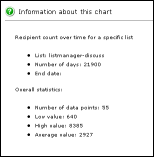
Information about the chart, including a legend. The legend can be set to appear by default by the server administrator, in Utilities: Administration: Server: Server Settings: Advanced: Enable Features, however even if no legend appears here (it was set to not appear), it can be viewed by clicking the question mark.
More
1. Reports
4. Reports: Server Performance
10. Reports: Maps