Tables in ListManager display a number of icons that change how you see your data, or act on that row
in the table. If you don't understand what you see on a page, just click the help icon to access context-sensitive help.
Table Options
![]() Toggle
Toggle
Changes the sort order of a table, from a-z to z-a, for example, or from most recent to least recent. By clicking the top triangle, the sort order will be ascending (a-z); clicking the bottom arrow makes the sort order descending (z-a). Sort options vary depending on the table.
![]() Spreadsheet Button
Spreadsheet Button
Downloads the current table in CSV (comma separated values) format. CSV files may be opened and edited with many programs, such as Excel.
![]()
Shows the next page of results.
![]()
Shows more results for a table, or increases the size of the field. Repeatedly clicking this button shows increasingly more lines.
![]()
Shows fewer results for a table, or shrinks the size of the field.
Chart Options
![]()
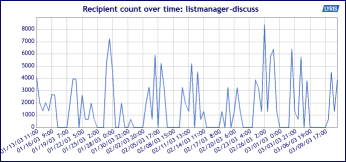
Line Chart
When you click on the Line Chart Icon, this is how you will see your data displayed:
![]()
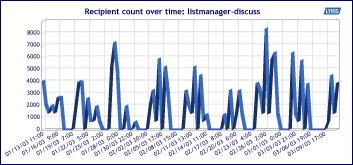
3D Line Chart
When you click on the 3D Line Chart Icon, this is how you will see your data displayed:
![]()
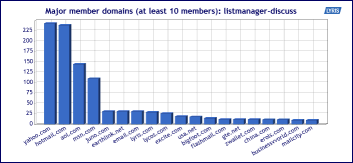
Bar Chart
When you click on the Bar Chart Icon, this is how you will see your data displayed:
![]()
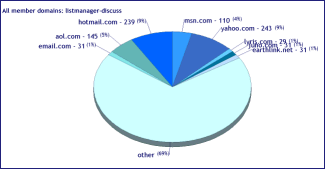
Pie Chart
When you click on the Pie Chart Icon, this is how you will see your data displayed:
![]()
Table
When you click on the Table Icon, this is how you will see your data displayed:
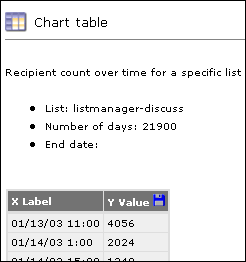
Note that the charts will only display 19 data points, but the chart table will have all the data points for that report. All the data for the selected report may be downloaded as a CSV file by clicking on the disk icon in the upper right hand corner of the table.
![]()
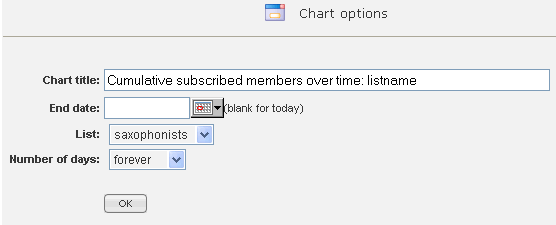
Click on the Change Chart Properties to change the parameters of your chart - the dates charted, for example.
![]()
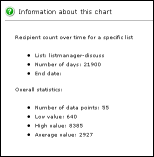
Information about the chart, including a legend. The legend can be set to appear by default by the server administrator, in Utilities: Administration: Server: Server Settings: Advanced: Enable Features; however even if no legend appears here (it was set to not appear), it can be viewed by clicking the question mark.
  |