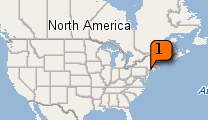
After you send a mailing, you can view the Map Report to see a breakdown of results according to state or province. For example, let's say you do a mailing where three members live in New York. When you open the Map Report, it looks like this:
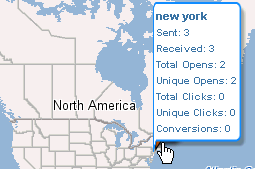
As you can see, the "1" graphic points to New York State. To see cumulative statistics on all mail sent to that state, move the pointer over the "1" graphic. A popup appears and displays the statistics:
In order for the Map Report to work, each member must have the following two demographics:
Country_
State_Province_
NOTE ListManager will only support a 3-character country code and 2-character state/province.
Important These names must be exact. If, for example, you already have a "Country" demographic but it doesn't end with an underscore, the Map Report will not work.
To add the necessary demographics to the members_ table
1. In the left Navigation bar, click Utilities : Administration : Server : Database : Add/Remove Member Columns : Add Column Wizard.
2. In the Description column under the Location sub-section, select Country and choose the three-character string - char(3) for the datatype and State/Province and choose the two character string - char(2) for the datatype.
3. Click OK.
To view the Map Report for a mailing
1. In the left Navigation bar, click Home.
2. Under Mailing Name, click the mailing you want.
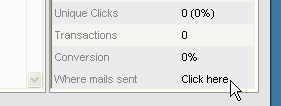
3. In the lower right corner next to Where mails sent, click Click here.
NOTE After you add the necessary demographics, the Map Report becomes available for all mailings, including past ones.