There are number of different reports and metrics available for you to analyze. The more you understand about what different metrics tell you about user activity on your Web site, the better equipped you’ll be to make adjustments and increase the success of your site.
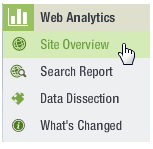
1. In the side navigation bar of the Lyris HQ screen, click Web Analytics. The first seven listings that appear are reports. Let’s take a look at the Site Overview report, which, as the title implies, gives you an overview of what visitors are doing at your site.
2. Click Site Overview.

This opens the Site Overview panel.

The Key Performance Indicators (KPI) Graph
The purpose of the Key Performance Indicators (KPI) graph is to show you immediate feedback on your most important KPIs when you view the Site Overview Report. You can display up to four KPIs at one time. (Learn more.)

Reports
To view a report
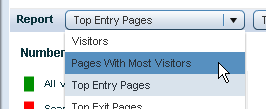
Click the Report drop-down list, and then select the report you want.

Learn about the types of reports.
The Search Report
Let’s take a look at the Search Report.
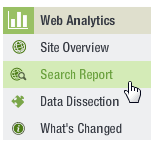
1. In the side navigation bar, click Search Report.

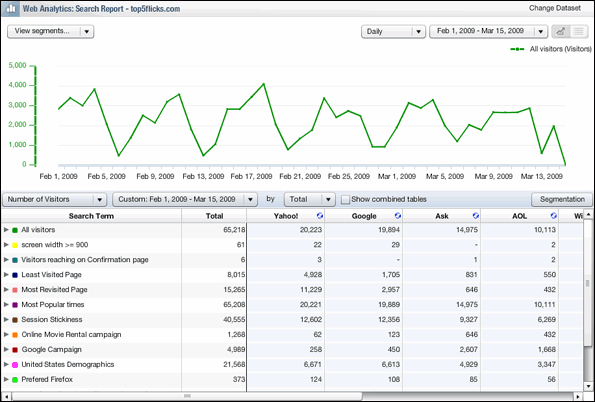
2. The search report opens in a new tab or window (depending on your browser settings). Go to that tab or window.
This report give you more detailed information about the search keywords that visitors use to reach your site from Google, Yahoo, et al.

Next: The ClickTracks Viewer