In Normal Mode, the Metrics Table displays segments at the root level in the first column. To view the visitor behaviors associated with each segment (Search Keywords in the example below), you must click the arrow to the left of the segment name.

Group Segments Mode reverses the order of display in the first column: the visitor behaviors are displayed at the root level, and you must click the arrow to the left of the behavior names to view the associated segments.

To switch to Group Segments Mode and change viewing options
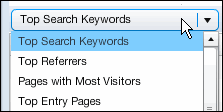
1. Click the Visitor Behavior drop-down list, and then choose the behavior you want.

2. Click the Date drop-down list, and then choose a date range. The last item in the list, Custom, lets you specify a custom date range.

3. Click the Segmentation button, and then choose the segments and metrics you want to include.

4. Select Group Segments.

To see all items associated with a visitor behavior
Click the arrow to the left of the segment name.
